Fiber Optic Supply Squeeze 2026: 180 Million Fiber-km Gap Drives Prices Up 418% — What ODN Buyers Need to Know
By Jergeo Engineering Team | August 2026 · 10 min read · Based on CRU Group, National Bureau of Statistics, and manufacturer filings
Summary
CRU Group calculates that global fiber demand in 2026 will reach 577 million fiber-kilometers, but effective supply is only 397 million fiber-kilometers — a 180 million fiber-km gap (16.4% shortfall), more than three times the 2018 peak shortage of 4.8%. G.652.D bare fiber spot prices hit $11.50/km in March 2026 (up 418% YoY). G.657.A2 bend-insensitive fiber jumped from $3–4/km to over $30/km in 12 months. Preform rod expansion takes 18–24 months and $560M per 3,500-ton line. The four largest manufacturers are at 100% utilization. The shortage is expected to persist through at least Q2 2027.
The Supply-Demand Gap in Full Perspective
The numbers from CRU Group paint a stark picture of the global fiber optic supply situation in 2026:
- Total global fiber demand (2026 projection): 577 million fiber-kilometers
- Effective global supply capacity: 397 million fiber-kilometers
- Supply gap: 180 million fiber-kilometers
- Shortfall rate: 16.4%
To put this in historical context, the previous fiber supply peak occurred in 2018 during the first wave of FTTH buildouts. At that time, the shortfall rate reached 4.8%. The current shortage is more than three times worse — 16.4% versus 4.8%. There is no precedent in the fiber optic industry for a supply gap of this magnitude sustained over multiple quarters.
CRU expects the highly constrained supply conditions to persist through at least Q2 2027, as new preform rod capacity requires 18–24 months to come online.
Price Surge: The Data
Fiber optic cable prices have moved from tight to extraordinary in the span of months:
G.652.D Standard Single-Mode Fiber
The workhorse fiber for long-haul and FTTH deployments. Bare fiber spot price reached $11.50/km by March 2026 — up 165% from January 2026 levels and a staggering 418% year-over-year. For context, G.652.D fiber was trading below $3/km as recently as mid-2024.
G.657.A2 Bend-Insensitive Fiber
The specialty fiber used in FTTH last-mile and data center indoor deployments has experienced even more extreme pricing. G.657.A2 fiber jumped from $3–4/km to over $30/km — a 10x price increase in 12 months. Global demand for G.657 fiber stands at 370 million fiber-kilometers, while China's effective production capacity is only 200–210 million fiber-kilometers — a gap exceeding 46%. Orders for G.657.A2 are now being booked through 2028.
Industry Profit Surge
China\'s National Bureau of Statistics reported that fiber manufacturing industry profits grew 410.4% year-over-year in the first half of 2026 — a figure that reflects the extraordinary margin expansion occurring across the supply chain as prices surge faster than raw material costs.
Why Supply Can't Ramp Quickly
The fundamental bottleneck is preform rod — the glass cylinder from which fiber is drawn. Preform manufacturing is the most capital-intensive and technically demanding step in fiber production, and it cannot be expanded overnight.
Capital intensity. A single 3,500-ton annual capacity preform production line requires approximately $560 million in investment. Even smaller expansions in the 300–800 ton range require hundreds of millions of dollars.
Timeline. Preform line construction and qualification takes 18–24 months from ground-breaking to full production yield. This means capacity announced today will not contribute meaningful supply until late 2027 at the earliest.
Utilization ceiling. The four largest Chinese fiber manufacturers — YOFC (长飞), Hengtong (亨通), ZTT (中天), and FiberHome (烽火) — are already operating at 100% capacity utilization. Their existing facilities can expand output by a maximum of 10–15% through debottlenecking, but this is insufficient to close a 16.4% supply gap while demand continues to grow.
Major Manufacturer Expansion Plans
Despite the timeline constraints, unprecedented capital is flowing into fiber capacity expansion:
- Far East Fiber (远东股份): ¥1.988 billion investment in AIDC preform project — scaling from 800 tons (2026) to 2,100 tons (2027), a 7x increase from current 300-ton capacity
- Rifeng Co. (日丰股份): ¥700 million investment for 300 tons of preform rod capacity plus 10 million fiber-km of annual fiber drawing capacity
- Han\'s Laser subsidiary (大族激光子公司): ¥2.52 billion investment for 60 million fiber-km annual fiber and preform rod capacity
Combined, these announced projects represent billions of dollars in new fiber capacity. However, the timing is the critical factor: meaningful supply contribution from these projects is not expected until mid-to-late 2027, and full-ramp production won't occur until 2028. The supply gap for the remainder of 2026 and the first half of 2027 is structurally locked.
ODN Perspective: Supply Chain Strategy and Stockpiling
For ODN passive component buyers, the fiber supply squeeze creates both direct and indirect challenges:
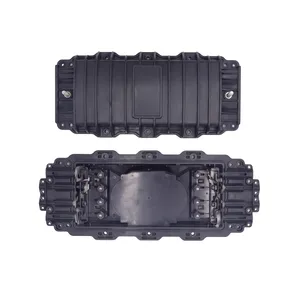
Front-loaded ODN demand. When fiber prices are surging and lead times extend from weeks to months, operators and integrators shift from just-in-time procurement to strategic stockpiling. They order fiber early and in larger quantities than immediately needed. But fiber cannot be terminated without ODN infrastructure — cabinets, ODFs, splice closures, and patch panels must be in place before the fiber arrives. This means ODN demand front-loads ahead of actual fiber deployment.
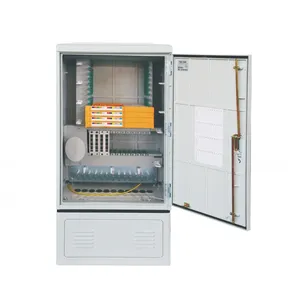
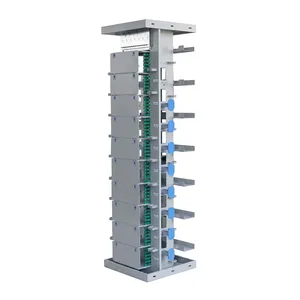
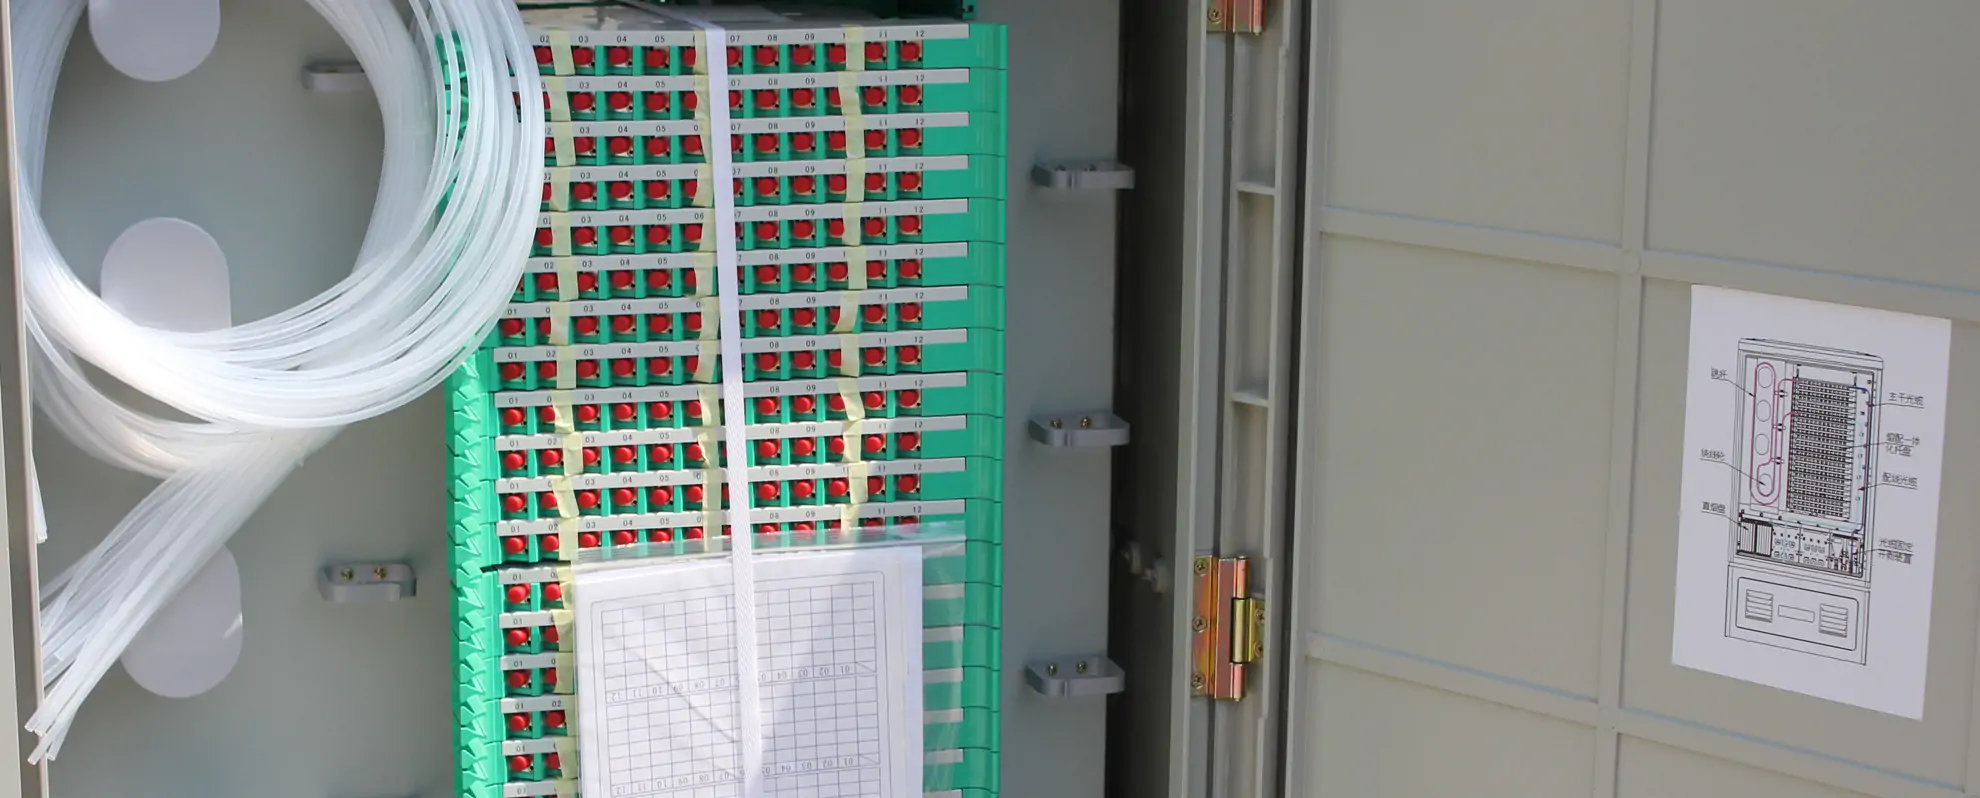
Cabinet and frame supply constraints. As fiber procurement accelerates, the downstream demand for fiber distribution cabinets and ODFs spikes in parallel. A 576-port FDC that was previously a standard stock item may now face 8–12 week lead times as manufacturers struggle to keep up with the surge in orders. The same applies to high-density ODFs and MPO patch panels for AI data center applications.
Spec changes cascade. When buyers cannot get their specified fiber type (e.g., G.657.A2 at any price), they may substitute with alternative specifications (e.g., G.652.D or G.657.A1). Each substitution may require different splice trays, different bend radius management, and different cable entry configurations in the FDC — creating engineering rework even after the cabinet has been ordered.
Risk Factors and Outlook
Several risks could extend or intensify the supply squeeze beyond CRU's Q2 2027 baseline:
Preform quality ramp. New production lines — particularly from cross-industry entrants without prior fiber manufacturing experience — typically require 6–12 months of quality ramp before their output meets carrier-grade specifications. If quality ramp takes longer than expected, effective supply will remain constrained even after physical capacity comes online.
Raw material availability. Preform manufacturing requires high-purity silicon tetrachloride (SiCl₄) and specialty gases. If upstream chemical supply tightens — which can happen when multiple new preform lines start simultaneously — the bottleneck simply shifts one step up the value chain.
Demand uncertainty. If AI data center construction accelerates beyond current projections (which is plausible given hyperscaler capex commitments), or if fiber optic drone programs expand faster than estimated, the demand side of the equation could widen the gap further.
For procurement teams, the practical implication is straightforward: do not wait for prices to normalize before placing orders. The 16.4% supply gap and 18–24 month expansion timeline mean that today's prices are likely lower than prices in six months. Secure ODN infrastructure supply now, in parallel with fiber procurement, to avoid deployment delays when the fiber arrives but the cabinets and distribution frames are still on backorder.
Sources
This article is based on CRU Group 2026 optical cable market supply-demand analysis. Price data from China fiber spot market reporting (January–March 2026). G.657.A2 supply-demand from industry sourcing data. Profit data from National Bureau of Statistics of China (国家统计局) H1 2026 industrial enterprise profit report. Expansion project data from Shanghai Stock Exchange filings (Far East Fiber SSE: 600869, Rifeng Co., Han\'s Laser subsidiary announcements). Capacity utilization estimates from manufacturer guidance and industry reporting.